Insights
Significant distribution in the Bitcoin network from all cohorts – similar pattern occurs after bear market bottoms

Definition
The Accumulation Trend Score (ATS) is an indicator that reflects the relative size of entities that are actively accumulating coins on-chain in terms of their BTC holdings. The scale of the ATS represents both the size of the entities balance (their participation score), and the amount of new coins they have acquired/sold over the last month (their balance change score).
An ATS of closer to 1 indicates that on aggregate, larger entities (or a big part of the network) are accumulating, and a value closer to 0 indicates they are distributing or not accumulating. This provides insight into the balance size of market participants, and their accumulation behavior over the last month.
Quick Take
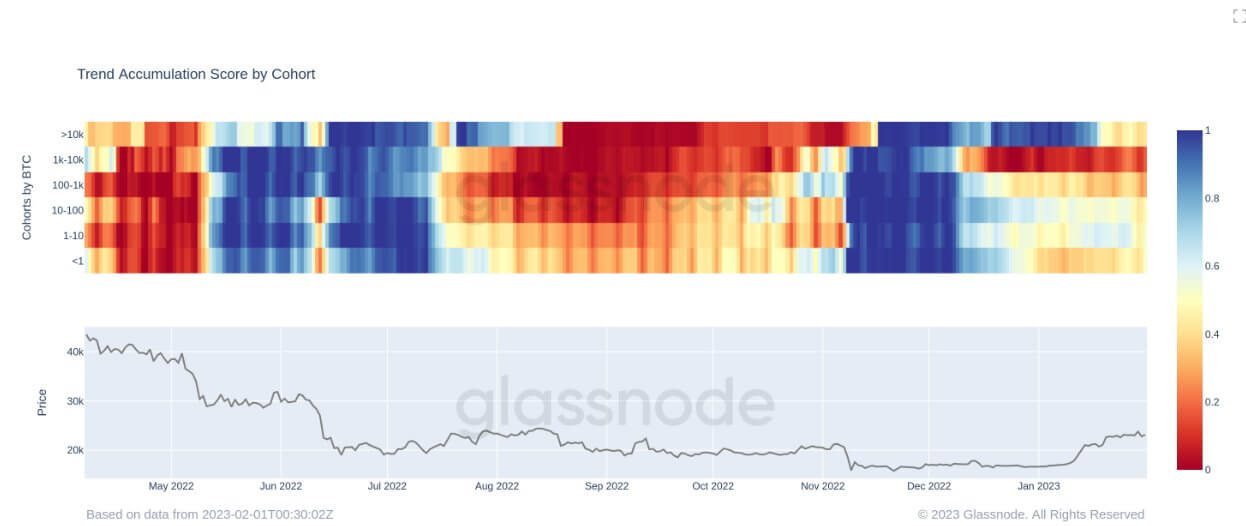
- Currently, the Bitcoin (BTC) network is seeing heavy distribution from all cohorts; this behavior was last seen after the Luna collapse in mid-2022, circled below.
- This comes after aggressive buying during the FTX collapse in November 2022, as all cohorts saw great value in the BTC price.
- The same behavior occurred after previous bear market bottoms in 2015, 2019, 2020, and 2022. Though distribution starts to occur as investors take profits, reluctance to continue accumulating can appear if investors express fear of a bull trap.

Accumulation trend score: (Source: Glassnode) 
Accumulation trend score by cohort: (Source: Glassnode)


