
Quick Take
According to Glassnode, investors accumulate and store (or lose) coins for extended periods, categorized based on how long it has been since they last moved on-chain.
The chart below displays an overlay of multiple Supply Last Active variants, each shown as a percentage of Circulating Supply.
- Supply Last Active 1+ Yrs Ago 🔴
- Supply Last Active 2+ Yrs Ago 🟠
- Supply Last Active 3+ Yrs Ago 🟢
- Supply Last Active 5+ Yrs Ago 🔵
Glassnode data suggests that these metrics will rise as longer-term investors accumulate coins. Conversely, as long-term investors spend and distribute their coins, this metric will decline, with older coins becoming young again as they change hands.
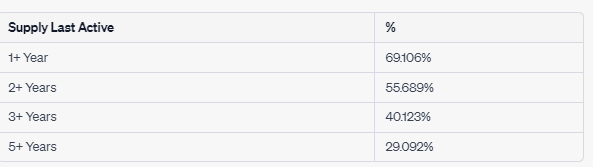
Data shows that we have hit an all-time high in every category once again for Bitcoin supply last active.
- 1+ Year = 69.106%
- 2+ Years = 55.689%
- 3+ years= 40.123%
- 5+ years= 29.092%

James Van Straten
James fervently appreciates data, technology, and trend-spotting. As a tech and liberty maximalist, he hails Bitcoin as the 21st century’s paramount invention.


