Bitcoin’s tight correlation with US equities highlights market anticipation of CPI data release

Quick Take
Bitcoin remains the primary indicator of global liquidity, with its price movements often preceding those of other risk-on assets. This dynamic was evident in the recent market cycle, as Bitcoin hit an all-time high on March 13, coinciding with the biggest ETF inflow since launch on March 12, over $1 billion, and the bottoming of the US Dollar Index (DXY), which typically has an inverse correlation with risk-on assets.
Since then, the DXY has strengthened from 102 to 105, exerting downward pressure on Bitcoin, dropping roughly 20%. Subsequently, the most liquid risk-on assets, such as the Nasdaq and S&P 500, peaked after Bitcoin, followed by gold. This sequence reinforces Bitcoin’s role as a leading liquidity barometer.

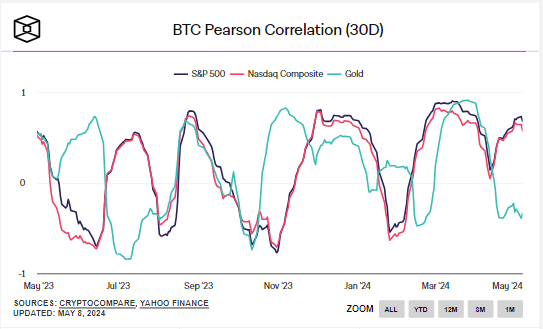
Bitcoin’s current correlation with US equities, represented by the S&P 500 and Nasdaq, currently stands at around 0.7 over the past 30-day moving average, indicating a strong tie to risk-on assets. Conversely, its correlation with gold has dropped to one of the lowest levels this year at -0.33.
With the upcoming release of US CPI inflation data on May 15, a hot inflation print could potentially dampen Bitcoin’s price, as it might delay or eliminate the possibility of interest rate cuts in 2024.
James Van Straten
James fervently appreciates data, technology, and trend-spotting. As a tech and liberty maximalist, he hails Bitcoin as the 21st century’s paramount invention.


